Median
In cases where we suspect outliers to be present in our data, we may want to use the median as our measure of central tendancy instead. Unlike the mean, the median is robust to outliers. Think of income in the United States; the top 1% is much higher than the rest of the population, so this will skew the mean to be higher and distort the perception of the average person’s income.
The median represents the 50th percentile of our data; this means that 50% of the values are greater than the median and 50% are less than the median. It is calculated by taking the middle value from an ordered list of values. In cases, where we have an even number of values, we take the average of the middle two values. If we take the numbers [0, 1, 1, 2, 9] again, then our median would be 1.
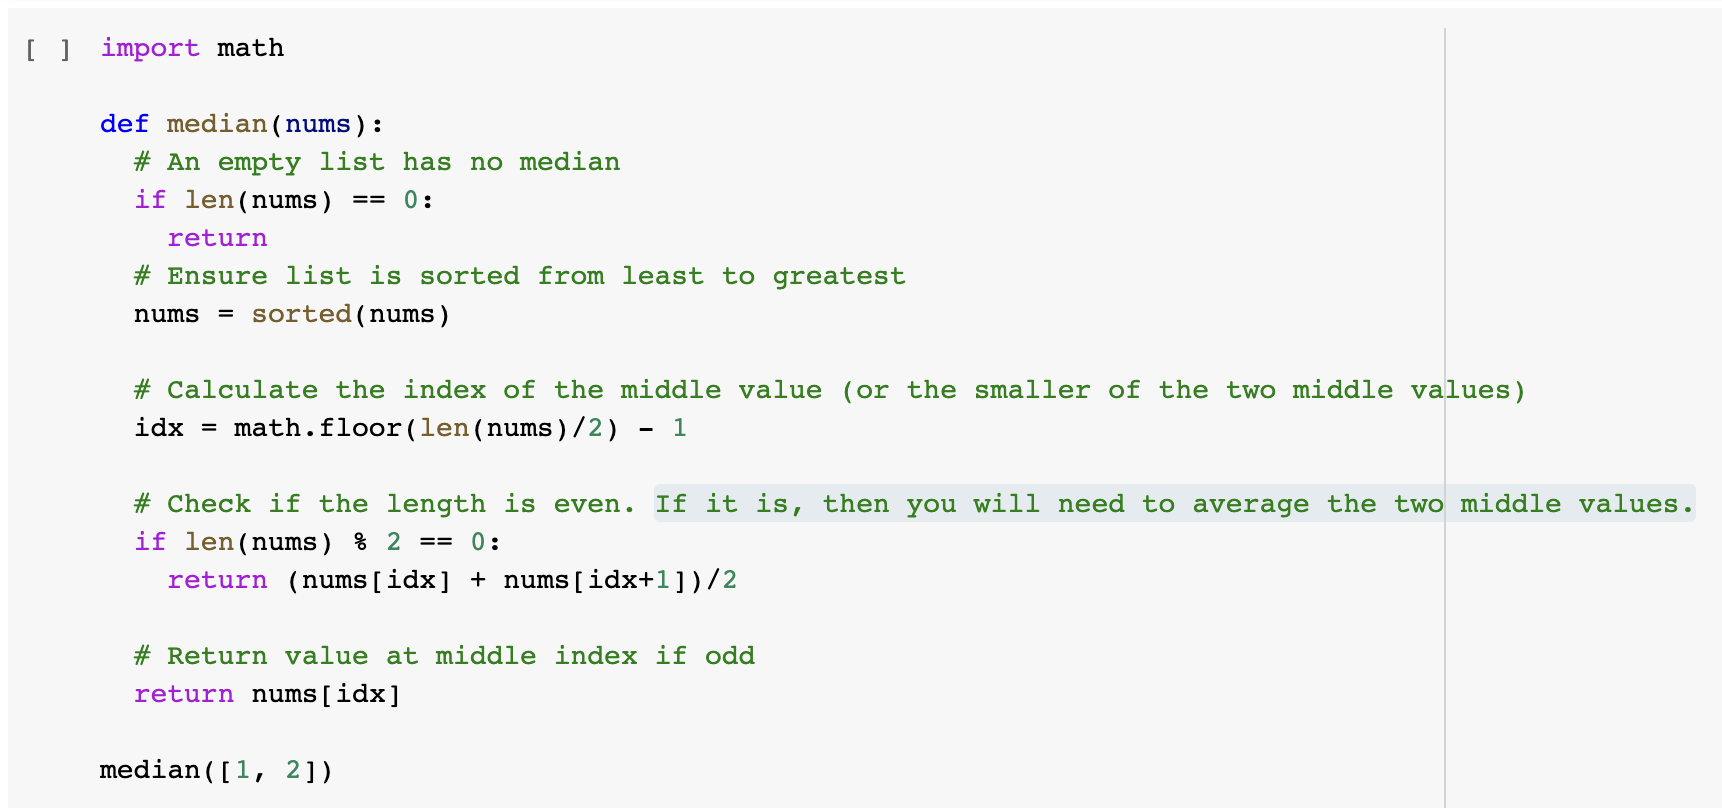
Calculating the median in python is not as easy as the mean because your computer will have to be identify the middle of an ordered list of numbers. How do you communicate the idea of a “middle” to a computer? You need to define a function in python, like so:
Don’t panic if this looks unfamiliar to you! We will rely upon python’s built in tools for calculations like these. Why reinvent the wheel if you don’t have to? Instead, we will do something like this in the future:
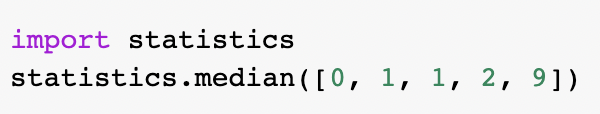
Don’t worry, we will complete a review of the important programming concepts that you need to know in order to understand why we can write these two lines of code instead. For now, let’s just continue reviewing descriptive statistics!