Mode
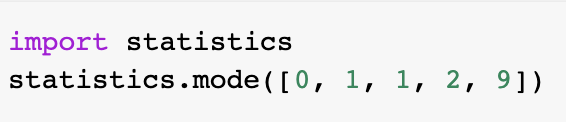
The mode is the most common value in a data set. For example, if we have [0, 1, 1, 2, 9], then 1 is the mode because it appears twice.
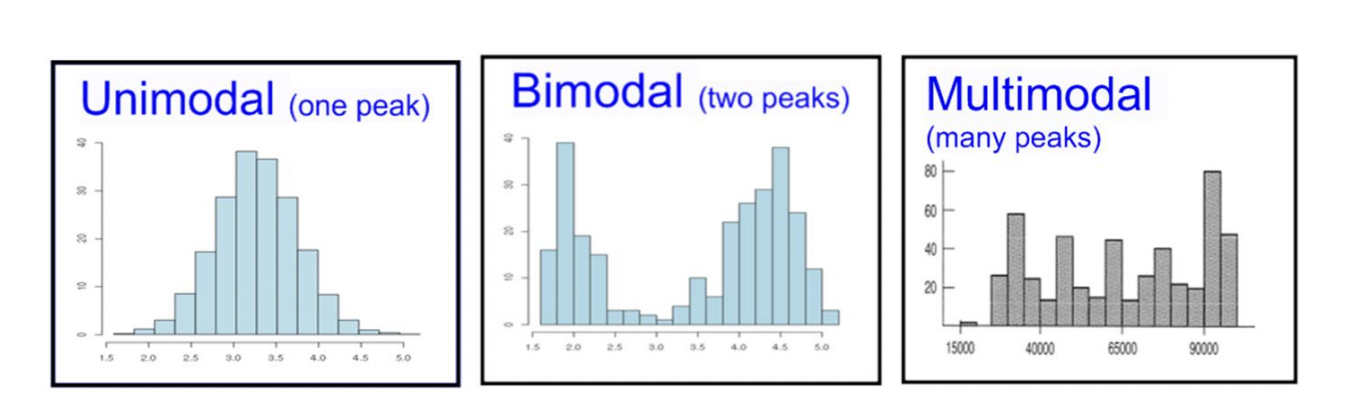
In practice, this isn’t as useful as it would seem, but we will often hear things like the distribution is bimodal or multimodal (as opposed to unimodal) in cases where the distribution has two or more most popular values. This doesn’t necessarily mean that each of them occurred the same amount of times, but, rather, they are more common than the other values by a significant amount. As shown in the following plots, a unimodal distribution has only one mode, a bimodal distribution has 2, and a multimodal distribution has many.
Understanding the concept of mode comes in handy when describing continuous distributions; however, most of the time when we’re describing our data, we will use either the mean or the median as a measure of our central tendency.
Curious to know how you might do this in python? Here’s the easy way:
Would like a challenge to develop your programming abilities? Try defining a function from scratch that returns the mode of a list of integers. What happens if you have two numbers that appear within the data set at the same frequency? 3? 4?