Interquartile Range
So far, other than range, we have discussed mean-based measures of dispersion; now, we will look at how we can describe the spread with the median as our measure of central tendency.
As mentioned earlier, the median is the 50th percentile or the 2nd quartile (Q2). Percentiles and quartiles are both quantiles – values that divide data into equal groups each containing the same percentage of the total data. Percentiles give this in 100 parts while quartiles give it in four (25%, 50%, 75%, and 100%).
Since quantiles neatly divide up our data, and we know how much of the data goes in each section, they are a perfect candidate for helping us quantify the spread of our data. One common measure for this is the interquartile range (IQR), which is the distance between the 3rd and 1st quartiles.
The IQR gives us the spread of our data around the median and quantifies how much dispersion we have in the middle 50% of our distribution. It can also be useful to determine outliers, which we will cover later in our course!
Quartile coefficient of dispersion
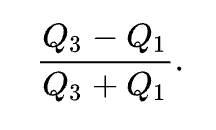
Just like we had the coefficient of variation when using the mean as our measure of central tendency, we have the quartile coefficient of dispersion when using the median as our measure of center. This statistic is also unit-less, so it can be used to compare data sets. It is calculated by dividing the semi-quartile range (half of the IQR by the midpoint between the first and third quartiles).
Here is the equation:
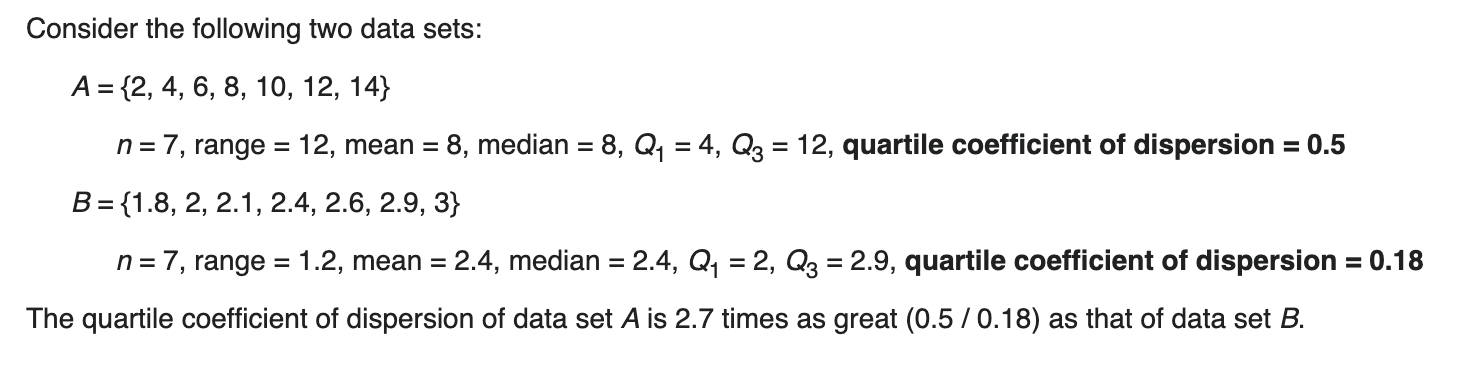
Here is an example:
Need an overview of spread calculations? Check this out: