Variance
You can probably imagine why the range is not always the most appropriate calculation of spread. The range gives us upper and lower bounds on what we have in a data set, however, if we have any outliers, the range will be rendered useless because those outliers directly impact the range’s calculation.
Another problem with the range is that it doesn’t tell us how the data is dispersed around its center; it really only tells us how dispersed the entire data set is. Enter the variance, which describes how far apart observations are spread out from their average value (the mean). The population variance is denoted as sigma-squared, and the sample variance is S^2.
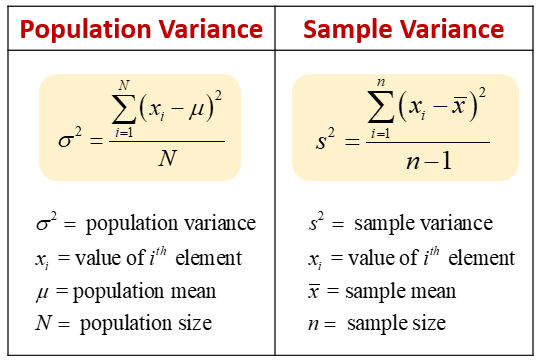
The variance is calculated as the average squared distance from the mean. The distances must be squared so that the distances below the mean don’t cancel out those above the mean. If we want the sample variance to be an unbiased estimator of the population variance, we divide by n-1 instead of n to account for using the sample mean instead of the population mean. This is called “Bessel’s Correction”, which just adjusts for the fact that humans tend to underestimate values associated with the population. Most statistical tools will give us the sample variance by default since it is very rare to be able to collect data for the entire population.