Standard Deviation
The variance gives us a statistic with squared units. This means that if we started with data on, let’s say, gross domestic product (GDP) in dollars, then our variance would be in dollars squared. This isn’t really useful when we’re trying to best estimate the spread of a data set (what is a squared dollar anyways?). Instead, we need a measure of spread with units that are the same as our data.
For this purpose, we can use the standard deviation, which is simply the square root of the variance. By performing this operation, we get a statistic in units that we can make sense of again.
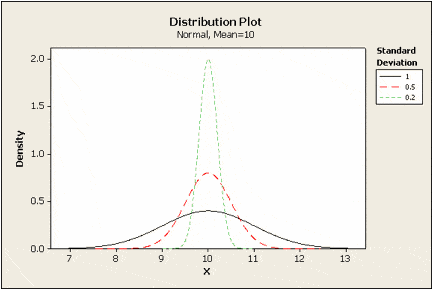
We can use the standard deviation to see how far from the mean data points are on average. Small standard deviation values mean that values are close to the mean; large standard deviations means that values are farther from the mean. This can be tied to how we would imagine the distribution of a curve; the smaller the standard deviation, the skinnier the peak of the curve; the larger the standard deviation, the fatter the peak of the curve.

