5-Number Summaries
The 5-number summary provides five descriptive statistics that summarize a data set. Which statistics do we need? Take a look:
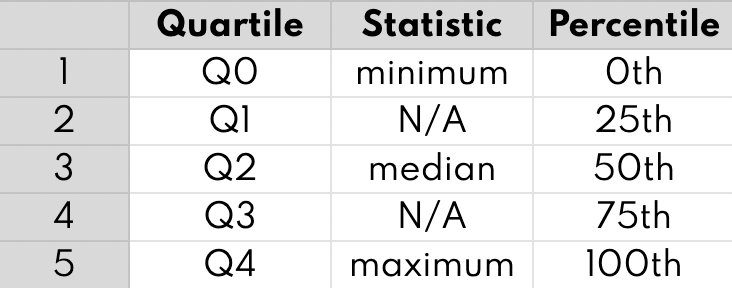
Looking at the 5-number summary is a quick and efficient way of getting a sense of our data. At a glance, we have an idea of the distribution of the data and can move on to visualizing it.
The box plot is the visual representation of the 5-number summary table. The median is denoted by a thick line in the box. The top of the box is Q3 and the bottom of the box is Q1. Lines extend from both sides of the box boundaries toward the minimum and maximum. For this class, the lower bound of the line will be Q1 - 1.5 * IQR and the upper bound will be Q3 + 1.5 * IQR, which is called the Tukey box plot:

You can learn about how to make box-plots in Google Sheets here: https://www.statology.org/box-plot-google-sheets/