Scaling Data
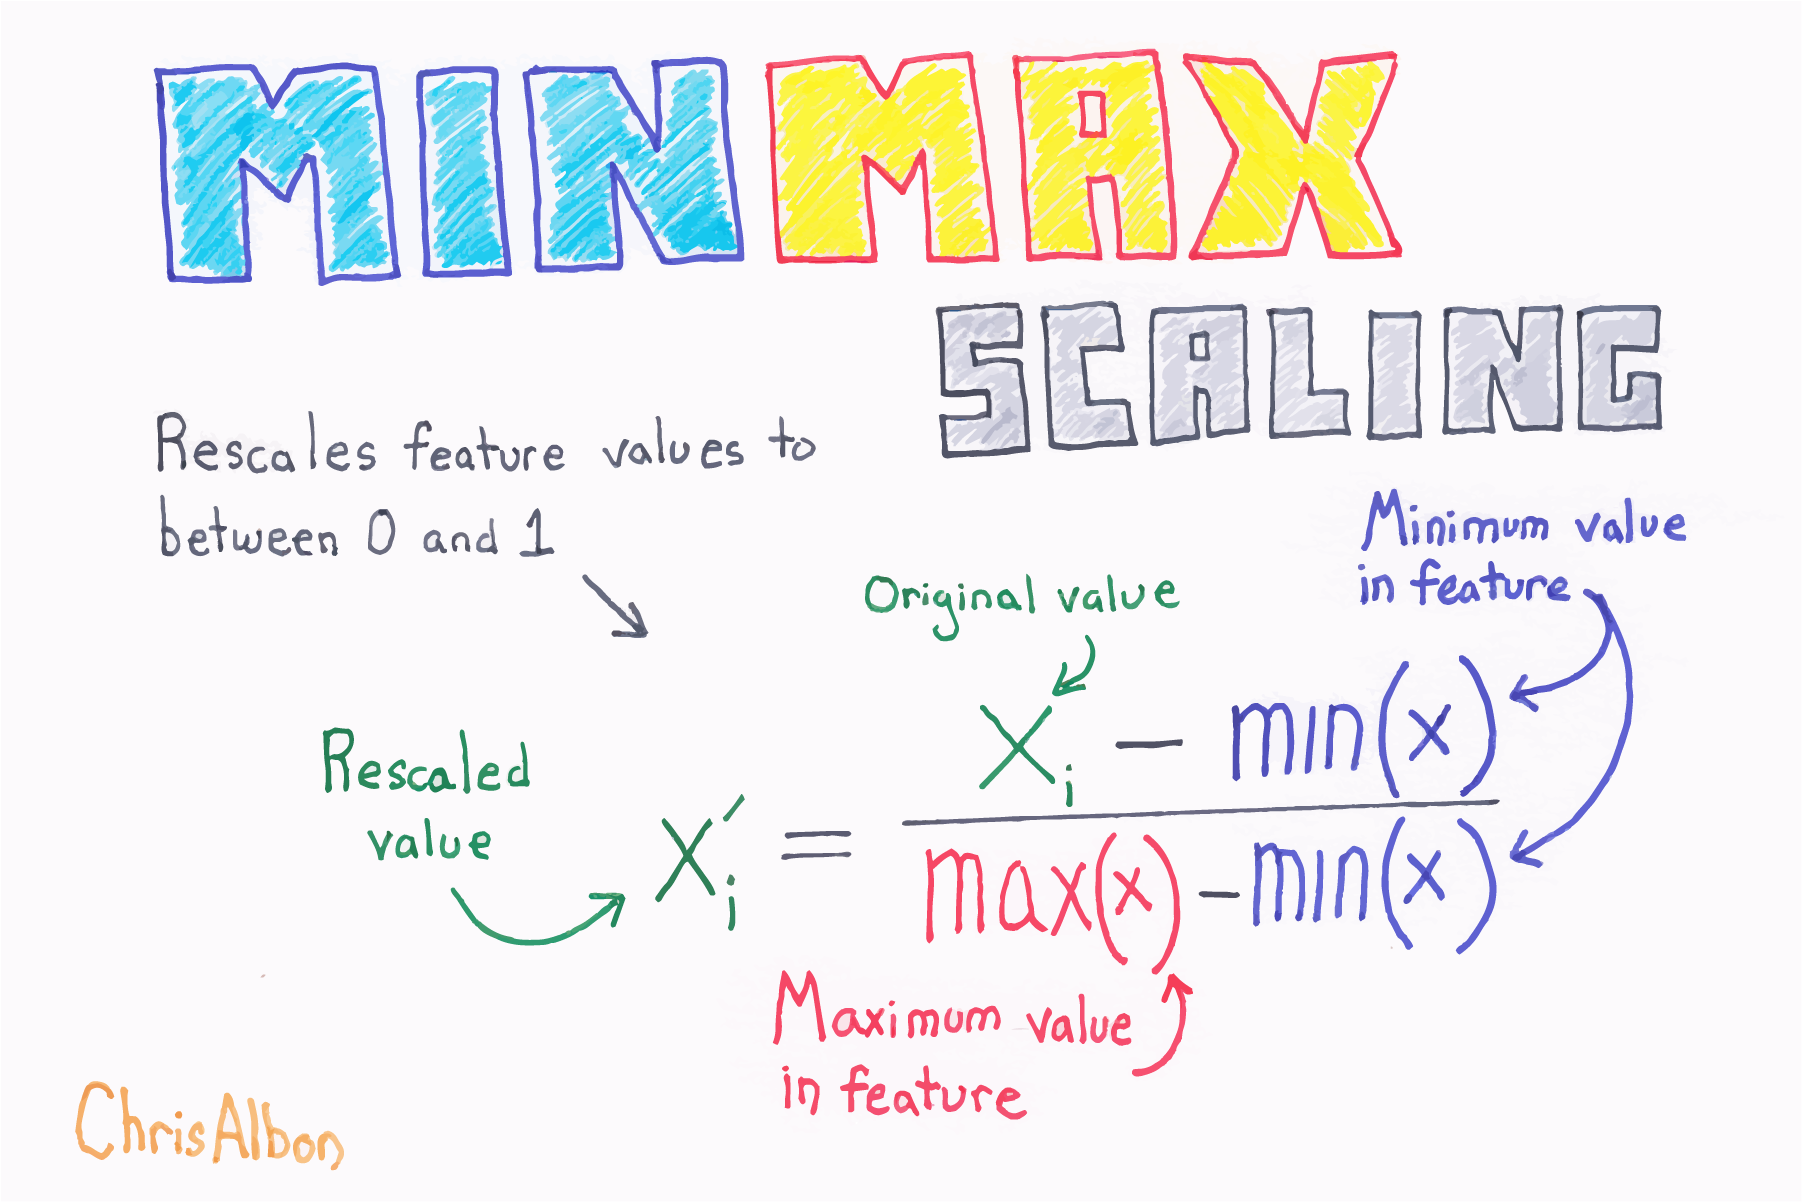
In order to compare data from different distributions, we would have to scale the data, which we could do with the range by using min-max scaling. We take each data point, subtract the minimum of the dataset, then divide by the range. This normalizes our data.

This isn’t the only way to scale data; we can also use the mean and standard deviation. In this case, we would subtract the mean from each observation and then divide by the standard deviation to standardize the data:

This gives us what is known as a Z-score. We are left with a normalized distribution with a mean of 0 and a standard deviation of 1. The Z-score tells us how many standard deviations from the mean each observation is; the mean has a Z-score of 0 while an observation of 0.5 standard deviations below the mean will have a Z-score of -0.5.
There are other ways to scale data and what you choose will be dependent on your data set. By keeping the measures of central tendency and measures of spread in mind, you will be able to identify how the scaling of data is being done in many other methods you come across.
